Reported Tuberculosis in the United States, 2022
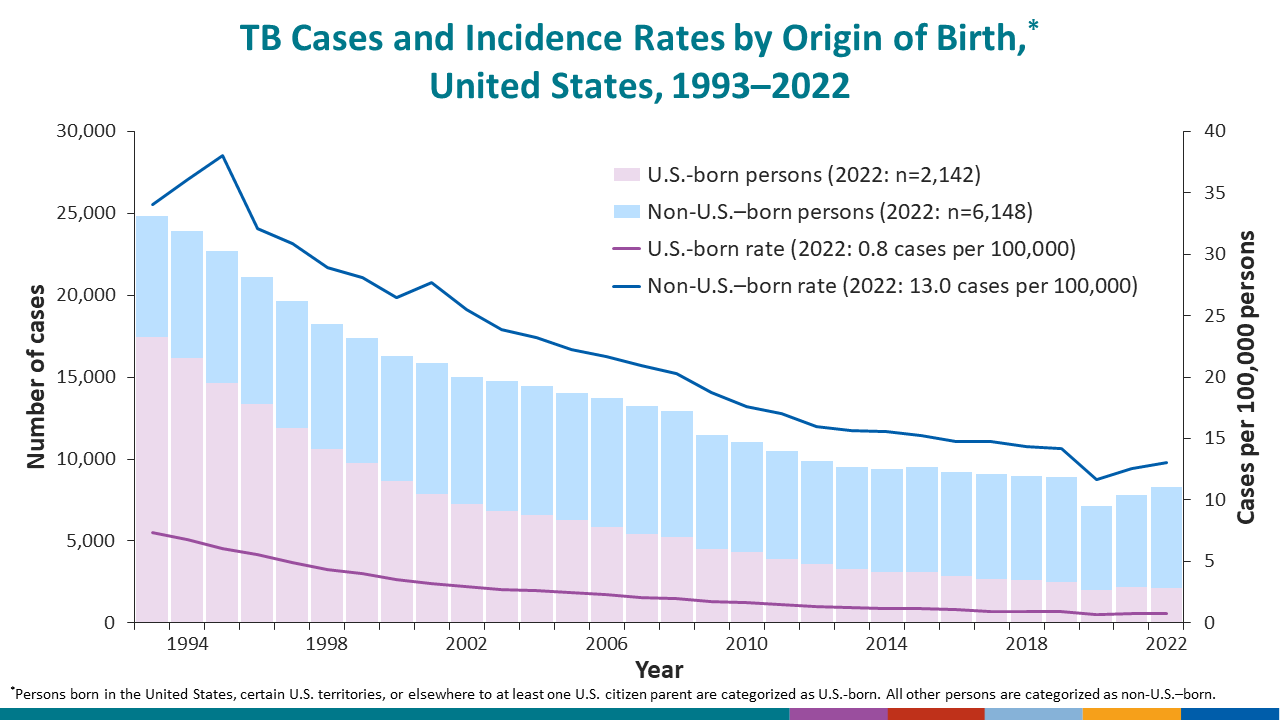
Table 8. Tuberculosis Cases, Percentages, and Incidence Rates per 100,000 Population by Origin of Birth:1 United States, 1993–2022
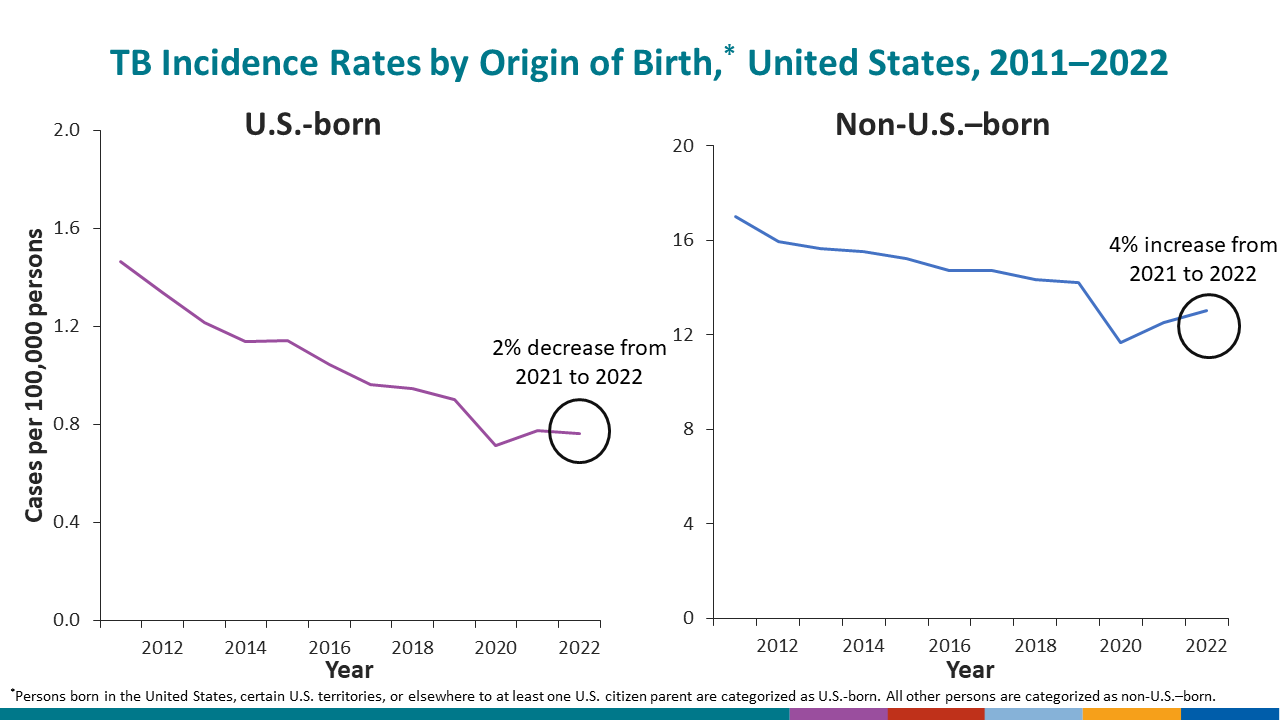
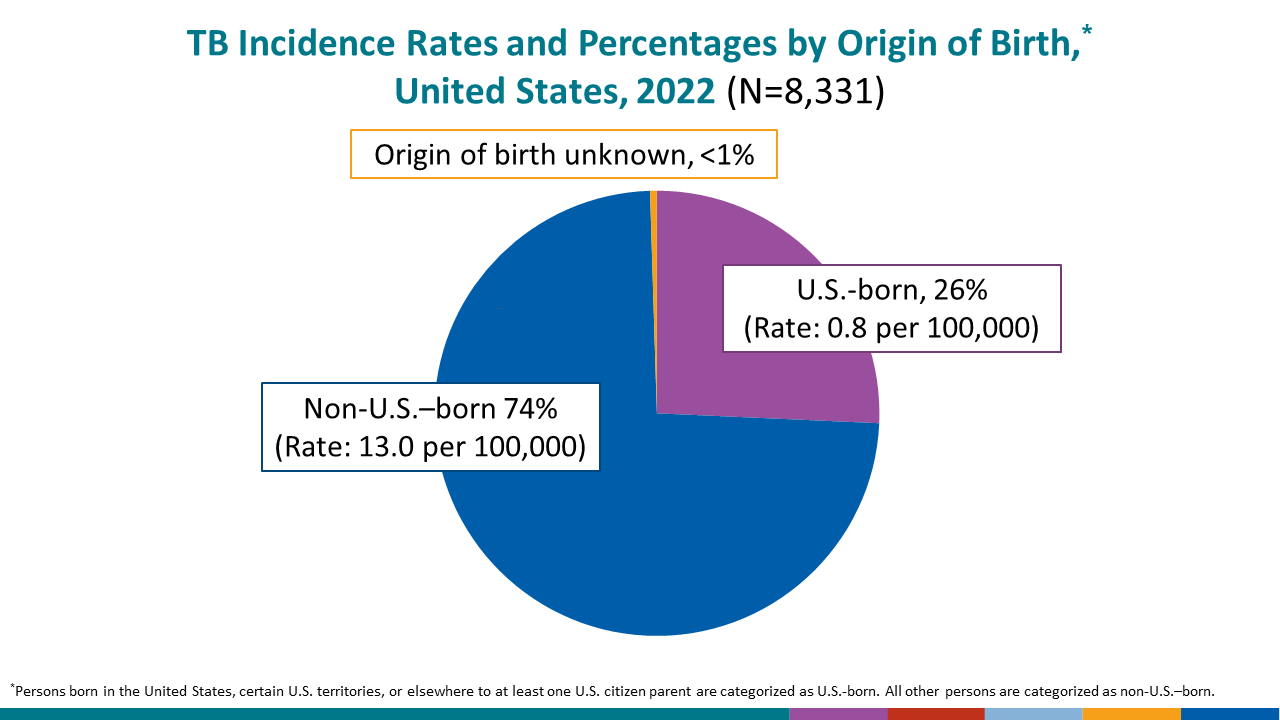
See surveillance slide #10, #11, and #12.
| Year | Total cases | U.S.-born | Non-U.S.–born | Unknown or missing | |||||
|---|---|---|---|---|---|---|---|---|---|
| No. | (%) | Rate | No. | (%) | Rate | No. | (%) | ||
| 2022 | 8,331 | 2,142 | (25.7) | 0.8 | 6,148 | (73.8) | 13.0 | 41 | (0.5) |
| 2021 | 7,870 | 2,177 | (27.7) | 0.8 | 5,629 | (71.5) | 12.5 | 64 | (0.8) |
| 2020 | 7,171 | 2,009 | (28.0) | 0.7 | 5,141 | (71.7) | 11.7 | 21 | (0.3) |
| 2019 | 8,895 | 2,516 | (28.3) | 0.9 | 6,367 | (71.6) | 14.2 | 12 | (0.1) |
| 2018 | 8,997 | 2,642 | (29.4) | 0.9 | 6,352 | (70.6) | 14.3 | 3 | (0.0) |
| 2017 | 9,069 | 2,661 | (29.3) | 1.0 | 6,402 | (70.6) | 14.7 | 6 | (0.1) |
| 2016 | 9,239 | 2,881 | (31.2) | 1.0 | 6,353 | (68.8) | 14.7 | 5 | (0.1) |
| 2015 | 9,538 | 3,126 | (32.8) | 1.1 | 6,406 | (67.2) | 15.2 | 6 | (0.1) |
| 2014 | 9,381 | 3,109 | (33.1) | 1.1 | 6,266 | (66.8) | 15.5 | 6 | (0.1) |
| 2013 | 9,513 | 3,303 | (34.7) | 1.2 | 6,201 | (65.2) | 15.6 | 9 | (0.1) |
| 2012 | 9,906 | 3,606 | (36.4) | 1.3 | 6,298 | (63.6) | 16.0 | 2 | (0.0) |
| 2011 | 10,471 | 3,914 | (37.4) | 1.5 | 6,552 | (62.6) | 17.0 | 5 | (0.0) |
| 2010 | 11,069 | 4,303 | (38.9) | 1.6 | 6,758 | (61.1) | 17.6 | 8 | (0.1) |
| 2009 | 11,491 | 4,484 | (39.0) | 1.7 | 6,990 | (60.8) | 18.8 | 17 | (0.1) |
| 2008 | 12,943 | 5,245 | (40.5) | 2.0 | 7,689 | (59.4) | 20.3 | 9 | (0.1) |
| 2007 | 13,276 | 5,427 | (40.9) | 2.1 | 7,789 | (58.7) | 20.9 | 60 | (0.5) |
| 2006 | 13,720 | 5,852 | (42.7) | 2.3 | 7,844 | (57.2) | 21.6 | 24 | (0.2) |
| 2005 | 14,053 | 6,286 | (44.7) | 2.5 | 7,737 | (55.1) | 22.3 | 30 | (0.2) |
| 2004 | 14,498 | 6,592 | (45.5) | 2.6 | 7,883 | (54.4) | 23.2 | 23 | (0.2) |
| 2003 | 14,835 | 6,833 | (46.1) | 2.7 | 7,956 | (53.6) | 23.9 | 46 | (0.3) |
| 2002 | 15,054 | 7,259 | (48.2) | 2.9 | 7,740 | (51.4) | 25.5 | 55 | (0.4) |
| 2001 | 15,946 | 7,840 | (49.2) | 3.2 | 8,043 | (50.4) | 27.7 | 63 | (0.4) |
| 2000 | 16,309 | 8,630 | (52.9) | 3.5 | 7,637 | (46.8) | 26.5 | 42 | (0.3) |
| 1999 | 17,494 | 9,777 | (55.9) | 4.0 | 7,625 | (43.6) | 28.1 | 92 | (0.5) |
| 1998 | 18,288 | 10,606 | (58.0) | 4.4 | 7,628 | (41.7) | 28.9 | 54 | (0.3) |
| 1997 | 19,753 | 11,920 | (60.3) | 4.9 | 7,759 | (39.3) | 30.9 | 74 | (0.4) |
| 1996 | 21,212 | 13,375 | (63.1) | 5.6 | 7,764 | (36.6) | 32.1 | 73 | (0.3) |
| 1995 | 22,727 | 14,652 | (64.5) | 6.1 | 8,022 | (35.3) | 38.1 | 53 | (0.2) |
| 1994 | 24,207 | 16,170 | (66.8) | 6.8 | 7,773 | (32.1) | 36.1 | 264 | (1.1) |
| 1993 | 25,105 | 17,423 | (69.4) | 7.4 | 7,416 | (29.5) | 34.1 | 266 | (1.1) |
1Persons born in the United States, certain U.S. territories, or elsewhere to at least one U.S. citizen parent are categorized as U.S.-born. All other persons are categorized as non-U.S.–born.
Note:
1) Denominators for computing incidence rates for year 1993 were obtained from Quarterly Estimates of the United States Foreign-Born and Native Resident Populations: April 1, 1990–July 1, 1999;
2) Denominators for computing the 1994-2018 rates are based on the U.S. Census Bureau, Current Population Survey via Data Ferrett for 1994-2018. This site has since been disabled by the U.S. Census Bureau. Current Population Survey estimates do not include institutionalized populations; and
3) U.S. Census Bureau’s MDAT tool for 2019–2022; accessed July 14, 2023.
Data for all years are updated through July 8, 2023.
Zero % (0.0) denotes <0.05%.
See Technical Notes.
